
About Me
Hi I'm Nasser BOINA, and I’m a Data Analyst skilled in data cleaning, visualization, and automation using Python. I specialize in creating automated workflows for data extraction and reporting, helping businesses save time and gain actionable insights.Let’s connect to explore how I can streamline your data processes !
Skills

Python | Excel | SQL | Power BI
Data Cleaning and Transformation
Exploratory Data Analysis (EDA)
Data Workflow Automation
Reporting and Visualization
Featured Projects
PYTHON
Portfolio reporting
An automated portfolio analysis tool for clients, built with Python, offering PDF reports featuring asset performance, risk assessment, and sector distribution analysis

SQL & PYTHON
Walmart sales
This project focuses on analyzing Walmart sales data to derive actionable business insights using SQL and Python. The goal was to transform raw data into useful information and answer key business questions that can guide decision-making.
Excel
Coffes Sales Dashboard
This project involves creating an interactive dashboard in Excel to analyse coffee sales, using graphs, segments and pivot tables to explore sales trends, customer preferences and product performance.

Python
Rest Estate Project
This project applies machine learning techniques (linear regression, ridge regression, pipelines) to predict residential real estate prices based on sales data from King County.
Python
Emerging Tech Skills Analysis
The goal of the project is to identify the most in-demand tech skills of 2025 by analyzing data from job postings and developer surveys, and present the insights in a PowerPoint for strategic decision-making.

POWER BI
Data Professional Survey Breakdown
The aim of the project is to analyze real survey data from data professionals to uncover insights about salaries, skills, and career trends through data cleaning and a Power BI dashboard.
Certification
Officially certified in data analysis

IBM Data Analyst Professional Certificate | Issued 2025
EXCEL | COFFEE SALES
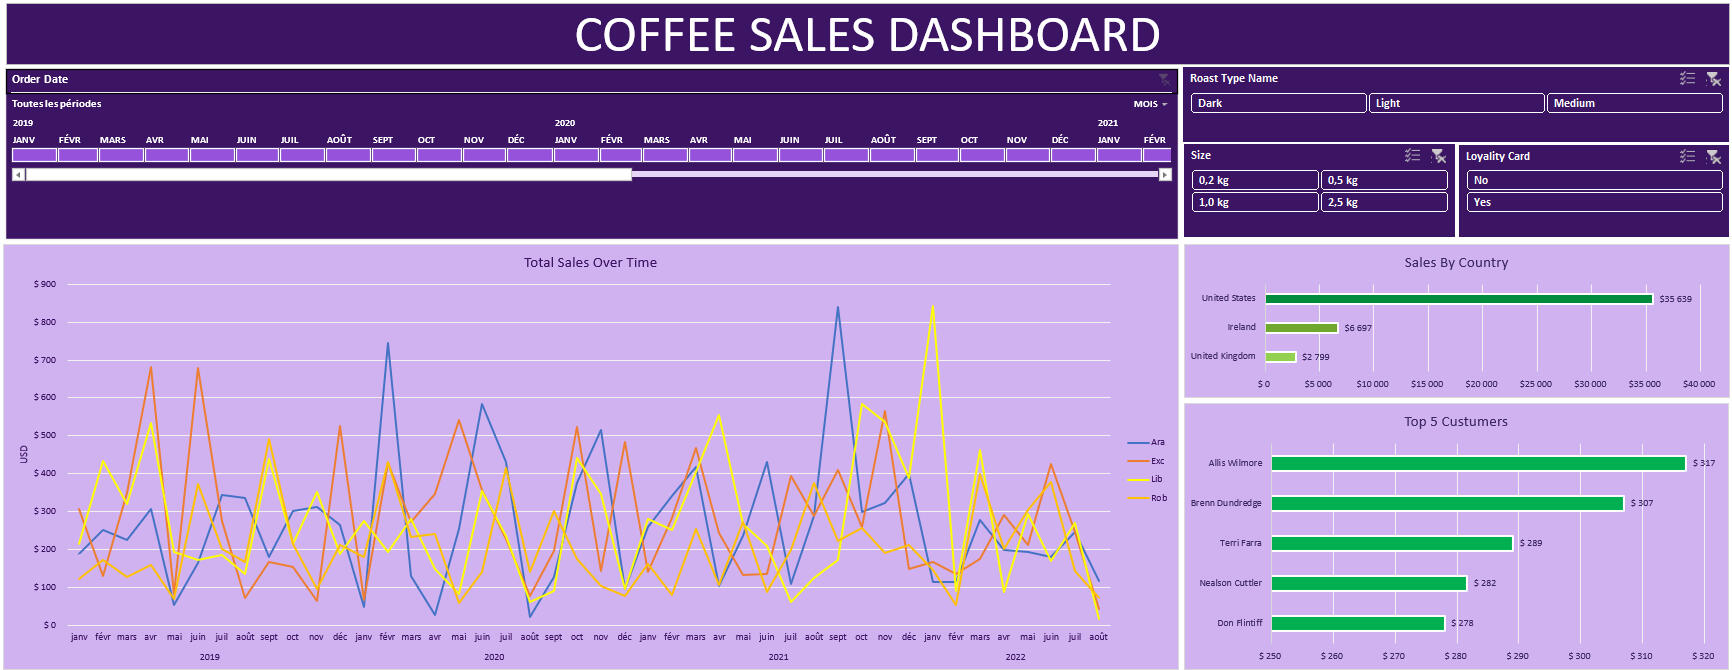
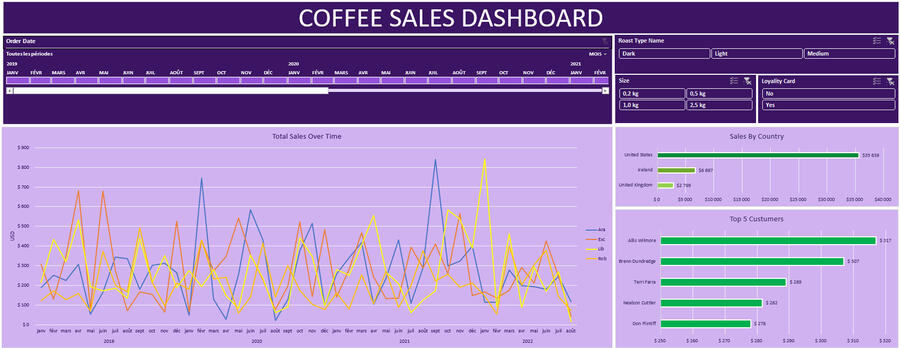
The Coffee Sales Dashboard is a project designed to analyze coffee sales data, providing insights into sales trends, customer preferences, and product performance.🛠 Tools and Skills Used
Visualization: Interactive charts and timelines.
Analysis: Pivot tables, advanced functions (INDEX, XLOOKUP).
Interactivity: Slicers for data filtering and exploration.📂 Data Sources
Data sourced from coffeeOrdersData.xlsx, including:Orders: Order details.
Customers: Customer information.
Products: Product data.🚀 Key Dashboard Features
Sales Timeline: Interactive trends of sales over time.
Sales by Roast Type: Filterable insights into customer preferences based on roast type.
Sales by Size: Analysis of the impact of product sizes on sales.
Loyalty Card: Comparison of sales between loyalty cardholders and non-cardholders.
Sales by Coffee Type: Trends by coffee variety (Arabica, Robusta, etc.).
Sales by Country: Bar chart highlighting key markets by sales volume.
Top 5 Customers: Visualizing the largest customers by sales volume.🎯 Objective
To provide a comprehensive view of coffee sales that supports data-driven decision-making. This project demonstrates the use of advanced Excel features to create an interactive and dynamic solution.
PYTHON | PORTFOLIO REPORTING
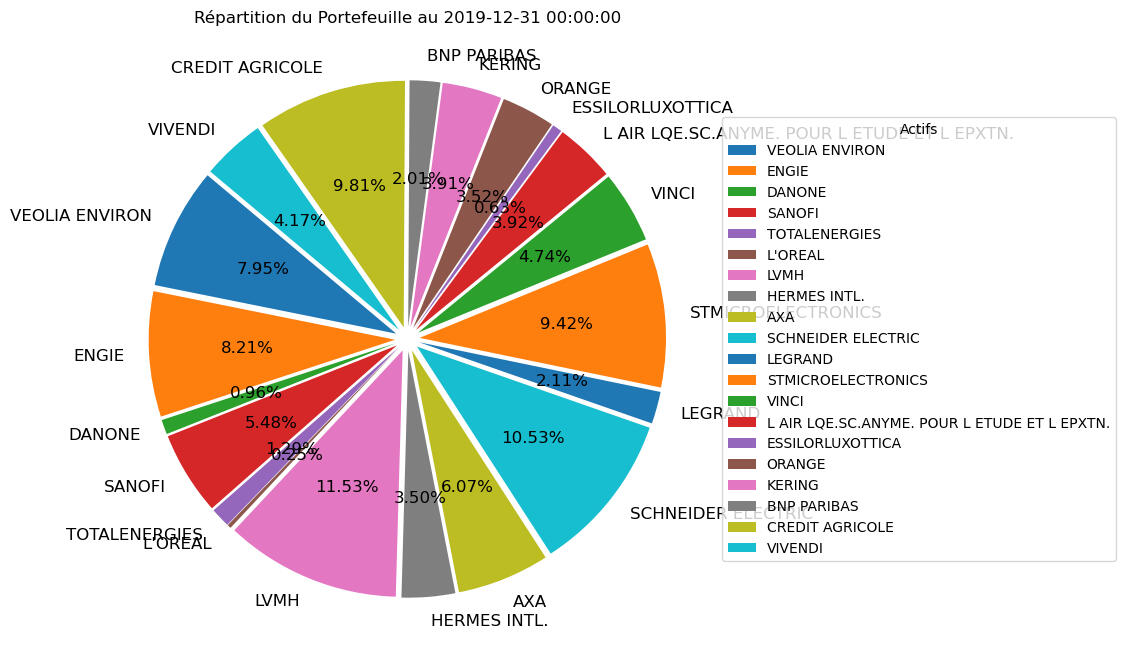
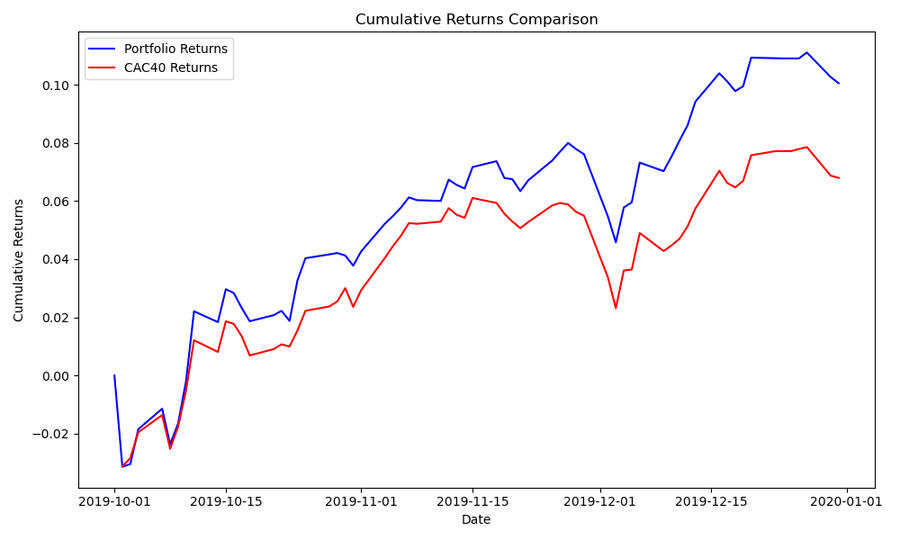
This portfolio analysis and reporting tool automates the creation of quarterly dashboards for entrepreneurial clients, providing insights into portfolio performance, asset allocation, and risk assessment. The tool leverages Python for data processing, analysis, and visualization.Key Features1. Automated Reporting: Generates professional PDF reports summarizing portfolio performance.
2. Comprehensive Analysis:
Asset allocation based on client risk profiles.
Portfolio statistics: cumulative return, daily return, volatility, and Sharpe ratio.
Sector breakdown and identification of top-performing and underperforming assets.
3. Visualization:
Pie charts for asset allocation.
Cumulative return comparison with CAC40 index.
Sector distribution and performance charts.Tools Used
Python: Core implementation, with libraries like Pandas, Matplotlib, and FPDF.
Tkinter: Provides a user-friendly interface for input and interaction.
Jupyter Notebooks: Facilitates code execution and analysis documentation.
Git & GitHub: Version control and collaboration.Data Sources
CAC40 Index: Historical index data (1990-2020).
CAC40 Closing Prices: Company-level data from 1994 to 2022.Challenges Overcome
Data Management: Handling and validating financial datasets and user inputs.
Visualization: Creating clear, well-structured charts and PDFs.
Error Handling: Ensuring robustness in processing and displaying outputs.Lessons Learned
Advanced data manipulation with Pandas.
GUI development using Tkinter.
Professional reporting through automated tools like FPDF.
Effective data visualization for financial analysis.
PYTHON & SQL| WALMART SALES
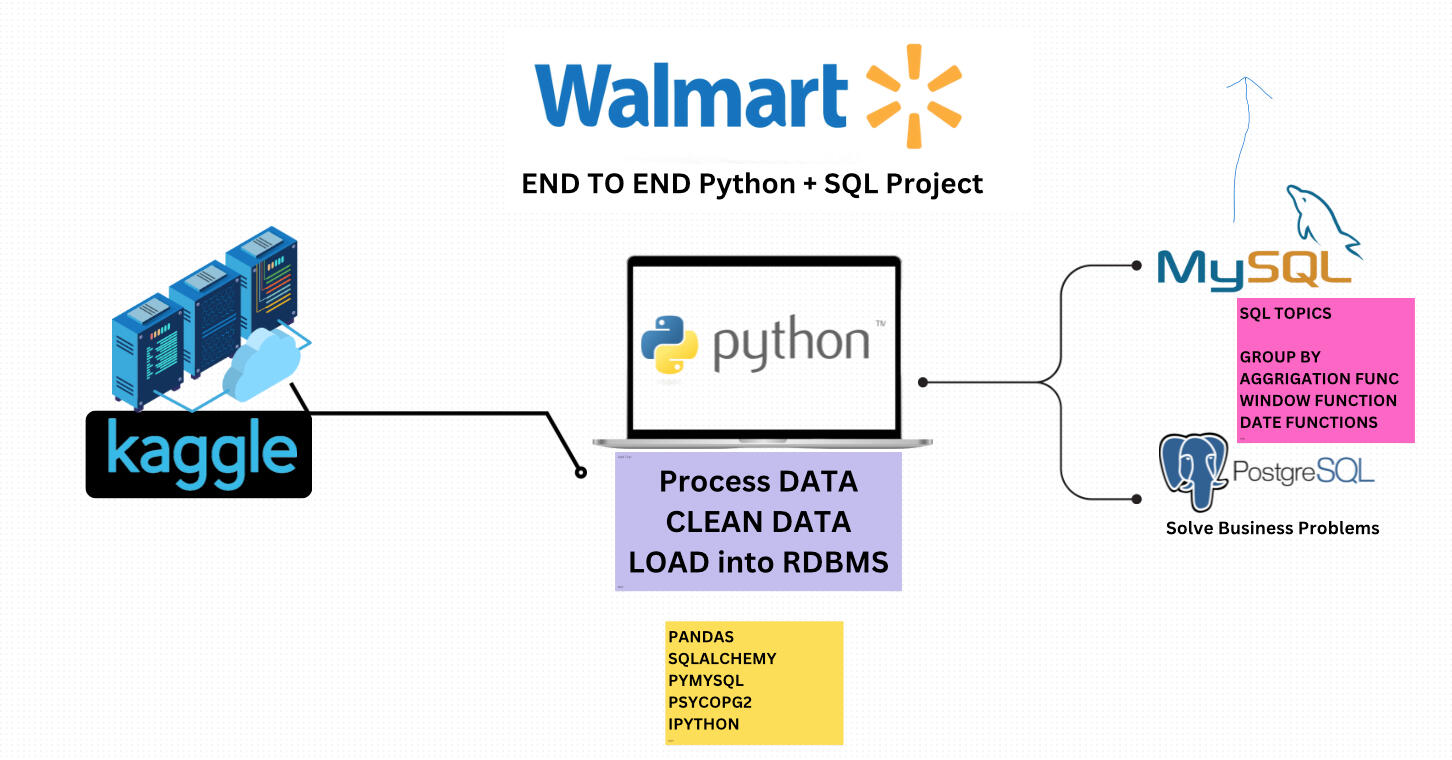
This project showcases my ability as a Data Analyst to transform raw data into actionable insights. Using a combination of Python for data cleaning and SQL for exploratory data analysis, I analyzed Walmart sales data to uncover trends and answer key business questions.Key Contributions
Cleaned and prepared raw sales data, resolving null values and standardizing columns.
Utilized advanced SQL queries to identify trends such as best-selling products, peak transaction periods, and most profitable categories.
Generated actionable business insights to inform inventory management, staffing, and marketing strategies.Insights Delivered
Top Product Categories: Fashion Accessories and Home & Lifestyle were the most profitable and best-selling categories.
Peak Transaction Times: Identified busiest days and time periods for each branch to optimize operations.
Payment Preferences: Determined the most common payment methods, enhancing customer experience planning.
Profit Maximization: Ranked product categories by profitability to prioritize investments.Skills Demonstrated
Data Cleaning: Handled missing values, harmonized column names, and ensured data integrity.
SQL Expertise: Mastered complex queries using ranking, grouping, and temporary tables.
EDA: Explored data to uncover business-critical trends and validate hypotheses.
Business Insight Generation: Transformed data into insights that drive strategic decisions.Tools Used
Python (Pandas, NumPy): For cleaning and preparing data.
PostgreSQL: For querying and analyzing sales data.
Visual Studio Code & Git: For coding, collaboration, and version control.Impact
This project illustrates how data analysis can guide decision-making in retail, from inventory management to targeted marketing. By leveraging data insights, businesses like Walmart can improve operational efficiency and maximize profitability
PYTHON| REAL ESTATE PROJECT

This project predicts house prices in King County (Seattle area) using machine learning models.📚 Project OverviewGoal: Build predictive models to estimate house prices based on property features.Data: Residential sales data (2014-2015) — includes size, bedrooms, bathrooms, location, etc.🛠 Tools Used
- Python, Pandas, NumPy- Matplotlib, Seaborn- Scikit-learn (Linear & Ridge Regression, Pipelines)- Jupyter Notebook📈 Key StepsData Cleaning: Dropped irrelevant columns, handled missing values.EDA: Visualized key relationships (e.g., living area vs price).Modeling:Simple & Multiple Linear RegressionRidge Regression to prevent overfittingPipelines with polynomial features🔥ResultsModel R² Score
Simple Linear Regression 0.49
Multiple Linear Regression 0.66
Polynomial + Ridge Regression 0.75💡 Learnings
Data preprocessing strongly impacts model performance.Pipelines streamline model building.Ridge regularization helps balance bias and variance.
POWERPOINT| EMERGING TECH SKILLS ANALYSIS

As a Data Analyst at a global IT consulting firm, I was tasked with identifying the most in-demand tech skills of 2025. Using data from job postings APIs and the Stack Overflow Developer Survey, I analyzed trends in programming languages, databases, and development tools.After collecting and cleaning the data (JSON sources), I structured it into a CSV format for dashboarding with IBM Cognos Analytics. The key findings, such as the dominance of Python, the rise of MongoDB, and the popularity of VS Code are all presented clearly in the PowerPoint presentation attached to this project.🔧 Tools Used:
- Python (data processing)- Pandas, NumPy- IBM Cognos Analytics- PowerPoint (final deliverable)- Git & GitHub📊 All insights and visualizations are available in the PowerPoint presentation:
DataAnalystPresentation
POWER BI| DATA PROFESSIONAL SURVEY BREAKDOWN

📊 Dataset Overview
We used real survey data from 2023, collected from data professionals worldwide.
It includes information on job roles, tools used, salaries, certifications, education, and more.🧹 Data Cleaning Before Dashboard
Before building the Power BI dashboard, we performed several cleaning steps:Column Removal: We deleted irrelevant or noisy columns (e.g. open-ended responses, duplicates).Column Splitting: Multi-answer columns (like tools and certifications) were split. Entries marked "Others" were excluded to focus on key trends.Here is the link of the dashboard : dashboard
Thanks !
Thank you for taking the time to visit my portfolio !
If you'd like to join your team, feel free to contact me